GHGSBTiMajor
Instant FLAG emissions insights
Get a clear, instant view of your FLAG vs non‑FLAG emissions and the split between land‑use change and land management. Filter by commodity or country to spot hotspots fast and move toward SBTi compliance with confidence.
View dashboard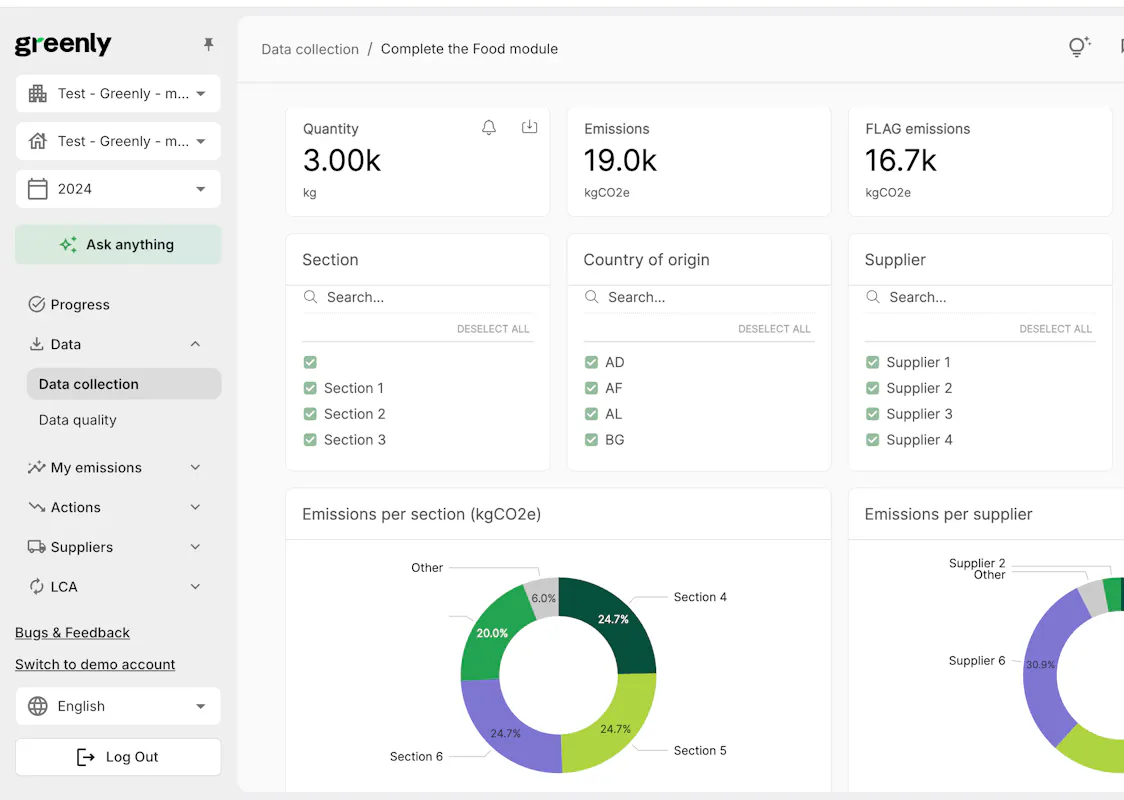
SEP 15, 2026


This website emits 2.76 kg of CO₂e per 1,000 visits per month. Your potential for action is measured in tons. Ready to take action to reduce your impact?