

Sustainable Development Goals (SDGs): All You Need to Know
1 min
Level
The United Nations has defined 17 goals, aimed at creating a better world. What are these so-called "Sustainable Development Goals" ? Explanations.
ESG / CSR
Industries

By Kara Anderson, UK Copywriter, on 09/29/2022
Updated by Kara Anderson, on 12/10/2025
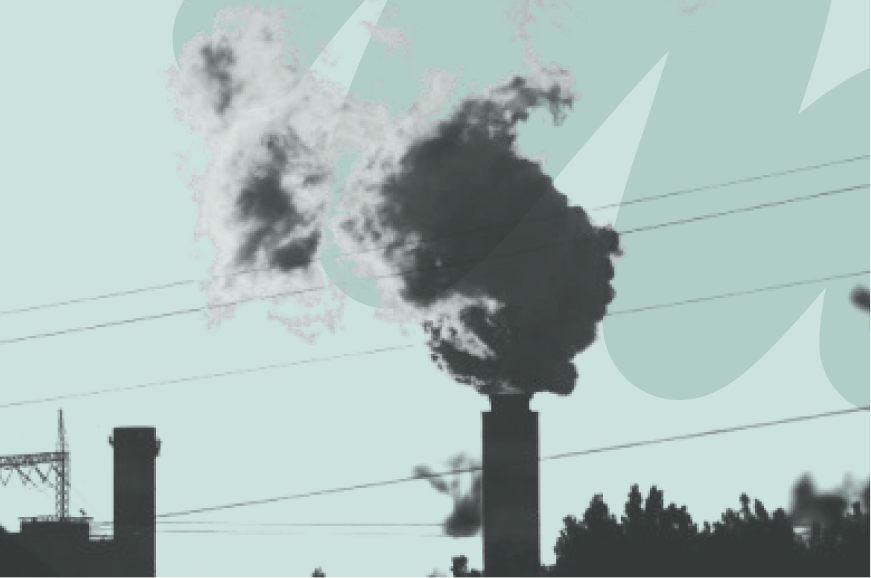
Carbon emissions sit behind almost everything we do: how we travel, how our homes and offices are heated, how products are manufactured, and how digital services are powered. Although they’re often discussed in technical or scientific terms, their impacts are very real, shaping weather patterns, ecosystems, and economic stability across the globe.
For companies, understanding carbon emissions has become a necessity. Emissions influence regulatory obligations, energy costs, supply-chain resilience, and how a business is perceived by customers, investors, and partners. Measuring where emissions come from is the first step toward reducing them in a credible and effective way.
What carbon emissions are and how they differ from wider greenhouse gas (GHG) emissions
Why rising CO₂ concentrations in the atmosphere matter
The main sources of carbon emissions
How companies can measure emissions across Scopes 1, 2, and 3
Practical ways businesses can start reducing their carbon emissions
Carbon emissions refer to the release of carbon dioxide (CO₂) into the atmosphere, mainly from burning fossil fuels for energy, transport, and heating, as well as from industrial processes and deforestation. As CO₂ accumulates, it traps heat in the atmosphere and disrupts the climate system, making carbon emissions a major driver of global warming.
As greenhouse gases build up in the atmosphere, they interfere with the planet’s natural balance. Seasons become less predictable, water stress increases, and extreme weather events become more frequent. Heatwaves, droughts, wildfires, rising sea levels, and biodiversity loss are no longer distant risks - they are already affecting communities and economies around the world.
These risks will keep growing unless carbon emissions fall. For businesses, the starting point is understanding their own impact. Measuring carbon emissions provides a clear picture of where emissions come from and helps companies plan how to reduce them over time.

Carbon dioxide (CO₂) is a naturally occurring gas that forms part of Earth’s carbon cycle. It is released when living organisms breathe out, when organic matter breaks down, and during natural events such as volcanic eruptions. Under normal conditions, this CO₂ is absorbed by forests, soils, and oceans, keeping the carbon system in balance.
Human activity has significantly altered that balance. Burning coal, oil, and natural gas releases large quantities of additional CO₂ into the atmosphere, far beyond what natural systems can absorb. Industrial processes, waste decomposition, and land-use change add to this excess.
As a result, atmospheric CO₂ concentrations have risen sharply since the Industrial Revolution. Levels that once fluctuated naturally around 280 parts per million have now exceeded 420 parts per million, a shift that is both rapid and unprecedented in human history.
Not exactly.
Carbon emissions usually refer specifically to carbon dioxide (CO₂). CO₂ is a heat-trapping gas released mainly through burning fossil fuels, industrial activity, and land-use change. Because it stays in the atmosphere for a long time and is produced in very large quantities, it’s the biggest contributor to human-driven warming.
Greenhouse gas (GHG) emissions is a broader term. It includes carbon dioxide, but also other gases that trap heat even more efficiently, molecule for molecule. The most significant of these are methane (CH₄), nitrous oxide (N₂O), and fluorinated gases used in refrigeration and industrial applications.
Together, these gases account for the full climate impact of human activity.
Global greenhouse gas emissions by gas:
A note on comparing different greenhouse gases: Because each greenhouse gas behaves differently in how strongly it traps heat and how long it stays in the atmosphere, scientists use a shared unit called carbon dioxide equivalent (CO₂e). This converts non-CO₂ gases into the amount of CO₂ that would cause the same warming effect, allowing emissions to be compared, added up, and managed consistently.
In 2024, global greenhouse gas emissions reached a record 53.2 gigatonnes of CO₂-equivalent (CO₂e), continuing an upward trend after the brief dip seen during the COVID-19 pandemic.
As these gases accumulate, they intensify the greenhouse effect, trapping more heat in the Earth’s atmosphere. The result is a steady rise in global temperatures. According to the World Meteorological Organization, 2024 was the warmest year on record, with average global temperatures reaching around 1.55 °C above pre-industrial levels.
Hotter, longer heatwaves
Rising average temperatures increase the frequency and duration of extreme heat, placing pressure on people, buildings, and energy systems.
Changing rainfall patterns
Rainfall is becoming more uneven, with heavier downpours in some regions and longer dry periods in others, increasing flood and drought risk.
Rising sea levels
Sea-level rise accelerates coastal flooding and erosion, threatening ports, housing, and transport infrastructure.
Higher risk of tipping points
As warming increases, natural systems may cross thresholds where changes become self-reinforcing and difficult to reverse.
Ecosystems under strain
Rapid climate shifts make it harder for ecosystems to adapt, driving biodiversity loss and weakening natural carbon sinks.
Water stress
Less predictable rainfall and growing demand intensify competition for freshwater across cities, agriculture, and industry.
Food system pressure
Heat, drought, and extreme weather disrupt crop yields and livestock productivity, increasing volatility in food supply and prices.
Supply-chain disruption
Extreme weather and resource constraints raise the risk of delays, shortages, and cost volatility across global supply chains.
Asset and infrastructure risk
Buildings, transport networks, and energy systems face greater exposure to flooding, heat damage, and storm impacts.
Rising insurance and financing costs
Physical climate risks are increasingly reflected in insurance availability, premiums, and access to capital.
Workforce health and productivity
Heat stress and extreme conditions affect worker safety, productivity, and absenteeism, particularly in exposed roles.
Global greenhouse gas emissions come from a wide range of human activities, but they can be grouped into a small number of economic sectors. How we produce energy, grow food, manufacture materials, manage waste, and use land largely determines where emissions come from.
By far the biggest source is the energy sector, which accounts for 75.7% of global greenhouse gas emissions. This reflects how central fossil fuels still are to modern life (everything from powering homes, factories, transport systems, and construction).
Electricity and heat account for 29.7% of global emissions
Transportation contributes 13.7%
Manufacturing and construction (energy use) make up 12.7%
Buildings account for 6.6%
Looking more closely, some everyday activities stand out. Residential buildings alone are responsible for 12.5% of global emissions, once electricity use and direct fuel use (such as gas heating and cooking) are included. Road transport is another major driver, accounting for 12.2% of global emissions, largely due to petrol- and diesel-powered vehicles.
Energy-related emissions have also risen quickly over time. Since 1990, emissions from electricity and heating have grown by 88%, transport by 66%, and manufacturing and construction by 60%, showing just how difficult it has been to meet rising energy demand without increasing emissions.
After energy, agriculture is the second-largest source of global greenhouse gas emissions, responsible for 11.7% of the total.
Most of these emissions come from biological processes rather than fuel use. Livestock farming, particularly methane from digestion and manure, plays a major role, alongside emissions from agricultural soils linked to fertilizer use. Agriculture can also drive emissions indirectly through land-use change and on-farm energy consumption.
Some emissions don’t come from burning fuel at all. Industrial processes account for 6.5% of global emissions, driven by chemical reactions during the production of materials such as cement, steel, and chemicals.
This category has grown faster than any other. Since 1990, industrial process emissions have increased by more than 225%, reflecting rising demand for construction materials and manufactured goods, especially in rapidly developing economies.
The waste sector contributes 3.4% of global greenhouse gas emissions, mainly through methane released from landfills and emissions from wastewater treatment. While smaller in share, waste emissions matter because methane is a particularly powerful greenhouse gas over shorter timeframes.
Land use and forestry account for a net 2.7% of global emissions, a figure that masks large underlying flows. Deforestation and land degradation release significant amounts of CO₂, while forests and soils also remove carbon from the atmosphere as they grow.
According to the EDGAR 2025 report, deforestation alone released around 3.7 gigatonnes of CO₂ in 2024, equivalent to about 9% of total global CO₂ emissions, even as managed forests continued to act as an important carbon sink.


In 2024, energy-related CO₂ emissions increased by 0.8%, reaching an all-time high of 37.8 gigatonnes of CO₂. This rise pushed atmospheric CO₂ concentrations to around 422.5 ppm, roughly 3 ppm higher than in 2023 and about 50% above pre-industrial levels.
While emissions continued to grow, the pace of increase was slower than global economic growth. In 2024, global GDP rose by 3.2%, while emissions rose by less than 1%, marking a return to the longer-term trend of partial decoupling between economic growth and emissions after the disruption seen in the early 2020s.
The rise in emissions in 2024 was driven mainly by natural gas and coal.
Global emissions trends in 2024 masked large regional differences.
Among major economies:
Rising temperatures played a significant role in emissions growth in 2024. The year was the warmest on record, and higher temperatures increased electricity demand for cooling, particularly during prolonged heatwaves.
Overall, higher temperatures contributed around 230 Mt of additional CO₂ emissions in 2024, accounting for roughly 80% of the net global increase in energy-related emissions compared with 2023. Around two-thirds of this temperature-driven increase came from China and India, where cooling demand surged during extreme summer heat.
Rapid deployment of solar PV, wind power, nuclear energy, electric vehicles, and heat pumps is beginning to have a measurable impact. Between 2019 and 2024, these technologies avoided more than 30 exajoules of annual fossil fuel demand, preventing around 2.6 gigatonnes of CO₂ emissions each year.
Without this expansion, global CO₂ emissions growth over the past five years would have been around three times higher. Even so, these gains have not yet been sufficient to offset rising energy demand at the global level.

Whatever their sector, businesses play a major role in driving carbon emissions, both through their own operations and through their wider value chain. If you want to reduce that impact in a meaningful way, the first step is understanding where your emissions actually come from.
Calculating the carbon footprint of a business starts with a simple formula:
Activity data describes what your company does or buys. It can be measured in physical terms, such as how much electricity is used, how far vehicles travel, or how much fuel or material is consumed, or, where physical data isn’t available, in financial terms, based on how much is spent on goods and services.
An emission factor translates that activity into emissions, in other words, how much CO₂ (or CO₂e) is released per unit of activity.
To make carbon footprints comparable and transparent, emissions are grouped into three categories, known as Scopes, under the Greenhouse Gas Protocol:
Scope 1
Direct emissions from sources a company owns or controls - such as fuel burned in company vehicles or on-site heating systems.
Scope 2
Indirect emissions from purchased energy - mainly electricity, heating, cooling, or steam supplied by utilities.
Scope 3
All other indirect emissions across the value chain - including suppliers, business travel, commuting, waste, and the use of sold products.
Scope 3 emissions are often the hardest to measure, but they are also frequently the largest share of a company’s footprint. Even a rough first estimate can be valuable, as it highlights where the biggest impacts sit.
Companies should always be clear about which scopes are included in their carbon footprint and disclose this transparently in their reporting.
Once activity data has been collected, companies can build a structured carbon footprint by following a few key steps:
Choose a baseline year. This becomes your reference point for tracking progress over time.
Define what’s included. Set clear organizational and operational boundaries — which sites, activities, and subsidiaries are covered.
Gather consumption data. Collect energy use, fuel consumption, travel data, purchasing data, and other relevant inputs across the business.
Apply emission factors. Convert activity data into emissions using recognised emission factor databases.
Use the results to plan reductions. Identify hotspots, prioritize actions, and define a realistic emissions reduction strategy.
Calculation always comes before reduction planning for a reason: every business has a different footprint. Measuring emissions reveals where action will have the greatest impact and often uncovers opportunities to improve efficiency, cut costs, and strengthen sustainability credentials in ways that matter to customers.

Once a company understands where its emissions come from, the focus can shift from measurement to action. Reducing carbon emissions is rarely about a single silver bullet. Instead, it’s about combining multiple, often incremental changes that add up over time.
Many companies start by setting a clear direction of travel, for example, a long-term emissions reduction target or an ambition to decarbonize specific parts of their operations. These targets help guide decision-making, but real progress comes from the actions that follow.
Below are some of the most effective ways companies can begin reducing their carbon footprint.
Yes. Despite progress in some countries and sectors, global carbon emissions remain at record levels. Energy-related CO₂ emissions reached a new high in 2024, driven by rising energy demand, particularly in emerging and developing economies. While clean energy deployment is slowing the rate of growth, it has not yet reversed the overall global trend.
Some sectors are more difficult to decarbonize because emissions are tied to physical or chemical processes that are hard to replace. Heavy industry, such as cement and steel production, aviation, shipping, and certain agricultural activities face structural constraints that make emissions reductions slower and more complex than in sectors like electricity generation.
US carbon emissions have fallen slightly in recent years, with energy-related CO₂ emissions down by around 0.5% in 2024, mainly due to the long-term decline in coal use and the rapid expansion of wind and solar power. However, the outlook is increasingly uncertain. Transport remains the largest source of US emissions, and recent policy shifts under the Trump administration, including the rollback of climate regulations and renewed support for fossil fuel production, risk slowing or reversing progress.
Scope 3 emissions often make up the largest share of a company’s carbon footprint. These emissions sit outside direct operational control but are closely linked to purchasing decisions, product design, logistics, and how products are used. Addressing Scope 3 emissions is challenging, but it is also where many of the biggest reduction opportunities lie.

Share this article
The United Nations has defined 17 goals, aimed at creating a better world. What are these so-called "Sustainable Development Goals" ? Explanations.
