

Decarbonization: what it is and why it matters
1 min
Level
What is decarbonization, and why is it urgent? Learn practical steps companies can take to support the global move toward net zero emissions.
ESG / CSR
Industries


By Kara Anderson, UK Copywriter, on 05/26/2023
Updated by Kara Anderson, on 07/03/2025
Most people assume that taking the train is better for the environment. It makes sense: trains can carry far more people than a single car, and they often seem like the more efficient option. But when you start looking at the details – how many people are in the car, what type of fuel is being used, or where the electricity is coming from – the answer gets a lot more complicated.
In this article, we’ll take a closer look at the carbon footprint of both cars and trains, and explore what really makes one greener than the other.

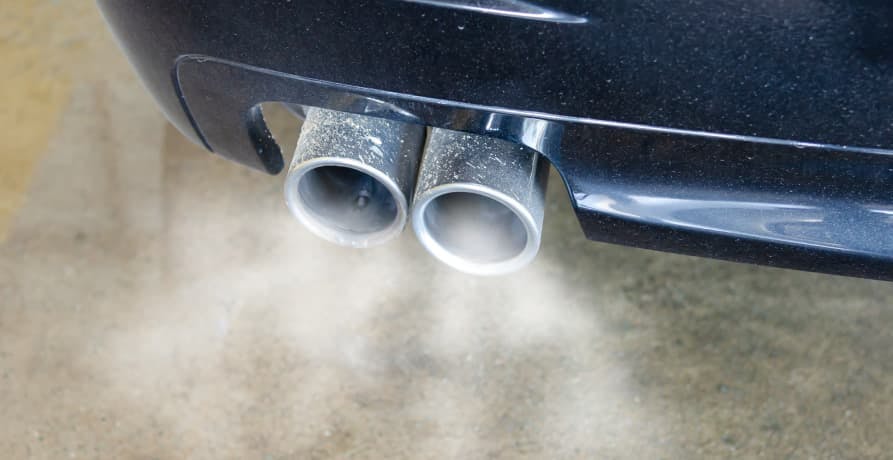
The main reason for this is that around 90% of the world’s transport energy still comes from fossil fuels such as petrol and diesel. Transport is also responsible for a major share of global oil use, accounting for around 57% of total oil demand. Burning these fuels releases large amounts of carbon dioxide into the atmosphere, where it traps heat and contributes to global warming.
Because the transport sector plays such a significant role in climate change, reducing emissions from this area is essential if we’re to meet global climate targets. But while efforts to decarbonize transport are underway – from electrification and cleaner fuels to policy changes – it’s a long-term process that won’t happen overnight.
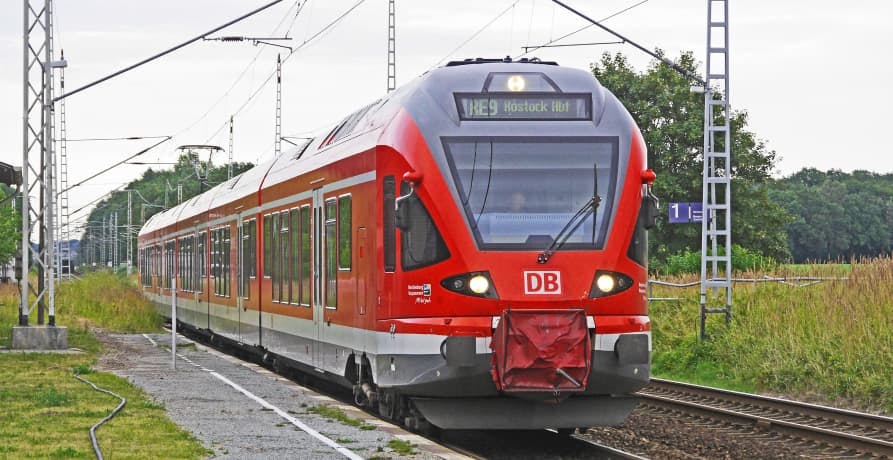
It’s widely assumed that taking the train is much better for the environment than traveling by car. The logic is simple: trains can carry hundreds of passengers at once, while most car journeys involve just one or two people. But does this assumption hold up under closer scrutiny?
According to the Intergovernmental Panel on Climate Change (IPCC), road transport accounts for approximately 70% of global transport-related carbon emissions, while rail is responsible for just 1%. These figures make it clear that, in absolute terms, road travel produces significantly more emissions than rail.
However, this high-level view doesn’t tell the whole story. To make a fair comparison, we need to look at emissions per passenger kilometer. And when we do, the picture becomes more complex, especially when considering factors like the type of car, fuel source, number of passengers, and how the train is powered.
The carbon footprint of travelling by car or train depends on several key factors – and the results can vary significantly depending on the situation. The biggest drivers of emissions are:
For example, here’s how average car emissions compare based on fuel type and passenger count:
| Car Type | 1 passenger | 2 passengers | 4 passengers |
|---|---|---|---|
| Petrol car | 192g CO2e | 96g CO2e | 48g CO2e |
| Diesel car | 171g CO2e | 85.5g CO2e | 42.75g CO2e |
| Electric car (EV) | 53g CO2e | 26.5g CO2e | 13.25g CO2e |
Note: figures are average emissions per passenger kilometer traveled. Source.
When compared with rail, the differences become clearer. Some of the most energy-efficient train services – such as the Eurostar, which is transitioning to renewable electricity – emit as little as 6g CO₂e per passenger kilometer. On the other hand, traditional national rail services, which often still run on diesel, produce an average of 41g CO₂e per passenger kilometer.
Train emissions can also vary by ticket class. Business and first-class carriages tend to carry fewer passengers, which means emissions per seat can be significantly higher than in economy class.
So, what do these numbers tell us?
In most cases, taking the train will result in fewer emissions than driving a petrol or diesel car, especially if you’re traveling alone. But the equation shifts when we factor in electric vehicles and car sharing.
Based on lifecycle analysis from the International Council on Clean Transportation (ICCT), a typical mid-sized electric car charged on the average European grid emits around 47 g CO₂e per kilometer. When shared between three to four passengers, this drops to approximately 12–16 g CO₂e per passenger kilometer, making a fully occupied EV comparable to, or potentially better than, many train journeys in terms of carbon footprint.
Electric vehicles (EVs) are becoming a common sight on roads around the world. In many countries, petrol and diesel cars are being phased out. For example, in the UK, the sale of new petrol and diesel cars will be banned by 2030, and all new cars and vans will need to be 100% zero emission by 2035.
This shift is being fuelled by:
Rail networks are also becoming greener. Electric trains are now widespread across Europe and other regions, and some countries are trialing hydrogen or battery-powered trains as low-emission alternatives to diesel.
But progress is slower – and one key reason is lifespan.
Trains, by contrast, are built to last. Rolling stock often stays in service for 30 to 40 years. While this makes rail durable and cost-effective, it also means that technological upgrades happen far less frequently.
While EVs are catching up fast, trains still tend to be more efficient per passenger kilometer – especially when powered by renewable electricity.
But in terms of technological progress, the car industry is moving more quickly, thanks to:
Both sectors are heading in the right direction, just at very different speeds.

The short lifespan of most cars is a major advantage when it comes to sustainability.
This is part of the reason why EVs have seen such fast growth in recent years.
Each time a new car is built, emissions are generated – regardless of whether it runs on petrol or electricity.
That’s because the production process includes:
The carbon footprint of a newly manufactured vehicle depends heavily on its size and type:
Although EVs start out with higher manufacturing emissions, they catch up fast.
On average, an electric car overtakes a petrol car in terms of total carbon footprint after just 21,700 km of driving.
After that point, the gap only widens, meaning the longer you keep an EV, the greater the climate benefit.

When comparing the sustainability of trains and cars, it’s easy to focus solely on tailpipe emissions or electricity use. But there are other environmental impacts that often get overlooked and these can significantly shift the balance.
Railways, roads, stations, tunnels and bridges all require vast amounts of materials and energy to build — and to maintain over time. These lifecycle emissions aren’t reflected in emissions-per-kilometer stats, but they do contribute to the total environmental footprint of transport.
One study found that rail infrastructure can generate up to 141% more emissions than the operational emissions from passenger rail. This highlights the hidden cost of building and maintaining extensive rail networks.
Beyond emissions, new transport infrastructure can also have a lasting impact on ecosystems. Whether it's a new high-speed rail line or a motorway expansion, construction often involves:
Both rail and road projects come with trade-offs. While trains are often more efficient in operation, their infrastructure can be just as disruptive to the environment.
A full comparison between cars and trains needs to go beyond what we see on the road or tracks. Materials used, land cleared, and long-term infrastructure maintenance all play a role in determining which mode of transport is more sustainable over its lifecycle.
While electric motors produce zero tailpipe emissions, the source of the electricity they run on can vary dramatically. Many energy providers still rely heavily on fossil fuels such as gas, oil, or even coal. Others offer electricity from renewable sources like wind, solar, and hydro.
This choice, whether made by a household, a business, or a national rail network, directly affects the carbon footprint of each kilometer traveled.
The emissions linked to electric transport also depend on the national energy mix. For example:
This means that an electric train or car used in France typically has a much lower carbon footprint than the same vehicle operating in the US, or even in the UK.
The electricity mix also affects the manufacturing emissions of vehicles. Electric cars or trains built in countries with greener grids start off with a smaller embedded carbon footprint, reinforcing the case for shifting to clean energy across the board.

In the US, car dependency remains dominant, with limited intercity rail options and chronic underinvestment in rail infrastructure. However, EV uptake continues to accelerate, even as recent policy rollbacks threaten to slow progress on transport decarbonisation.
Trains typically come out ahead when it comes to carbon emissions – especially for solo travel and longer distances. But as we've seen, the answer isn’t always so black and white. With the rise of electric vehicles, car sharing, and greener energy mixes, there are cases where driving can be just as sustainable – or even more so.
And the picture gets even more complicated when you factor in manufacturing emissions, infrastructure impacts, and how fast green tech is advancing in the automotive sector. Some experts even argue that in the near future, cars may outperform trains on environmental grounds – particularly in countries with clean electricity grids.
So what’s the smartest choice? It depends on your specific journey and your setup. Here’s a quick checklist to help guide your decision:
Trains typically have the lowest carbon footprint – especially for solo travellers or longer distances. But as we’ve seen, driving (especially in an electric or shared car) can sometimes be just as sustainable, depending on the context.
Here’s a quick decision guide:

At Greenly, we help companies understand and reduce the environmental impact of their activities – whether it’s transport, infrastructure, or energy use.
Here’s how we can support your sustainability journey:
| How Greenly helps | What it means for you |
|---|---|
|
📊 Measure your carbon footprint
|
We help businesses track their emissions across Scope 1, 2, and 3 – from energy use to purchased goods and beyond. |
|
🔍 Identify reduction opportunities
|
Our platform highlights the biggest drivers of your emissions and shows you where to take action first. |
|
📄 Simplify reporting and compliance
|
Whether you need to meet CSRD, SECR, or GHG Protocol requirements, our tools and expert support make climate reporting seamless. |
|
♻️ Go deeper with Life Cycle Assessments
|
We analyze the full environmental impact of your products or services – from raw materials to end of life. |
|
🌍 Build a more sustainable strategy
|
From setting science-based targets to engaging your suppliers, we support long-term, meaningful change. |
Want to turn sustainability into action? Get in touch to see how Greenly can help.

Share this article
What is decarbonization, and why is it urgent? Learn practical steps companies can take to support the global move toward net zero emissions.

In this article, we’ll break down what IROs are, how to identify and assess them, and what CSRD requires in terms of disclosure.

In this article, we break down what the EU CBAM is, how it works, and what businesses need to do to comply.
