

Comment calculer son empreinte carbone ?
1 min
Level
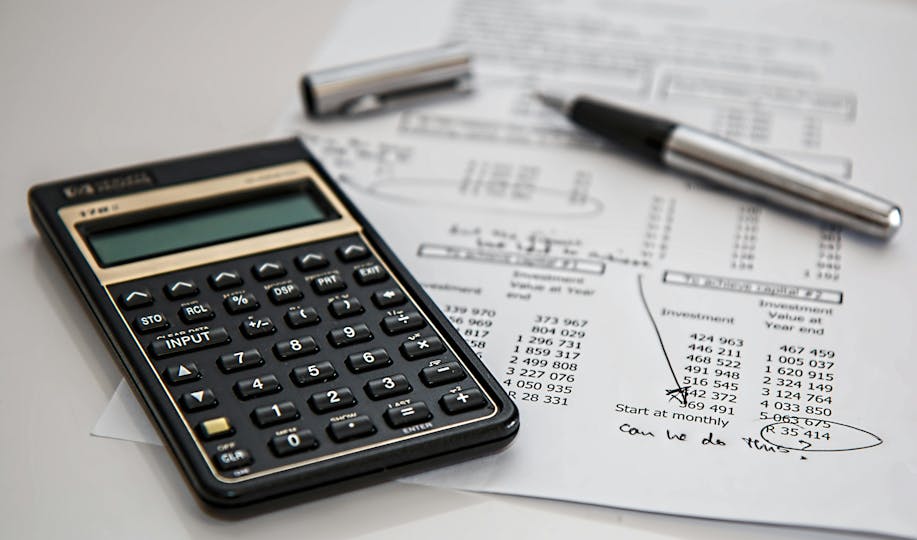
L'empreinte carbone est un outil permettant d'évaluer le niveau d'émissions de gaz à effet de serre (GES) générées. Mais que faut-il savoir à son sujet ?
ESG / RSE
Secteurs d'activité
L'empreinte carbone est un outil permettant d'évaluer le niveau d'émissions de gaz à effet de serre (GES) générées. Mais que faut-il savoir à son sujet ?
Le Bilan Carbone® est une méthode de comptabilité carbone créée par l’ADEME et portée par l'Association pour la transition Bas Carbone (ABC).
Pour évaluer correctement son empreinte carbone, une entreprise doit étudier ses scopes d'émissions 1, 2 et 3. Mais de quoi s'agit-il ?

La VSME (Voluntary Sustainability Reporting Standard for SMEs) est une norme de reporting ESG volontaire destinée aux PME non cotées.

Le recyclage d’une bouteille en plastique est l’une des actions primordiales pour limiter la pollution de plastique. Comment fonctionne ce procédé ?

Envie de soutenir une entreprise vraiment éthique ? Découvrez les signes qui ne trompent pas pour repérer les entreprises qui font rimer business avec conscience.
Nous protégeons vos données avec notre politique de confidentialité.

Derniers articles

Qu'est-ce que le règlement ESPR, et en quoi ce dernier constitue-t-il un formidable levier pour l'évolution de votre entreprise ? Greenly vous dit tout.
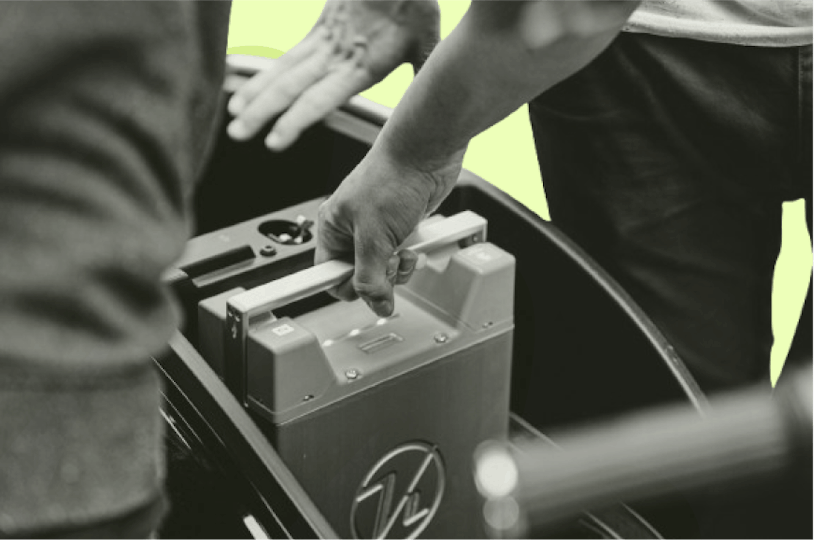
Pour simplifier, la batterie utilise un électrolyte solide (en polymère, en céramique ou en composite) pour faire circuler l'énergie entre leurs électrodes.
En 2026, le TOP 5 des meilleurs logiciels VSME est : 1.Greenly, 2.CONSUST FramesCube, 3.Diligent ESG, 4.Plan A et enfin 5.Daato.
En 2026, Les meilleurs logiciels pour se conformer aux normes IFRS sont : 1. Greenly ; 2. Workiva et 3. Persefoni.

Les concerts, comme tant d'autres événements, sont synonymes d'empreinte carbone. Ce qui ne signifie pas qu'ils ne peuvent pas se réinventer.

La proposition de loi Duplomb a émergé fin 2024, dans un contexte de tension extrême (qui n'avait rien d'inédit) au sein du secteur agricole.

L’éco-branding ne consiste pas simplement à apposer une feuille sur un logo ou de le décorer d’un fond vert, – c'est aussi remettre en question les pratiques.

Le risque de tsunami en Méditerranée est réel - quoique malheureusement méconnu. D'où l'importance de le comprendre et de se préparer.
Après épuration (élimination du soufre, de l’eau et du CO₂), le biogaz devient du biométhane, un gaz aux propriétés identiques à celles du gaz naturel.

Notre langage industriel est très complexe, mais la nature dit bien davantage avec moins de mots et une syntaxe plus simple (source : Cairn, 2018).