

Decarbonisation: what it is and why it matters
1 min
Level
What is decarbonisation and why is it urgent? Learn practical steps companies can take to support the global move toward net zero emissions.
ESG / CSR
Industries


By Kara Anderson, UK Copywriter, on 26/02/2024
Updated by Kara Anderson, on 04/05/2026
For many businesses, emissions have become part of the core reporting landscape. They show up in disclosures, supplier requirements, and internal decision-making, and are increasingly expected to be tracked with the same consistency as financial data.
Before any of that can happen, there needs to be a clear way to organise and understand what’s being emitted, and where it comes from.
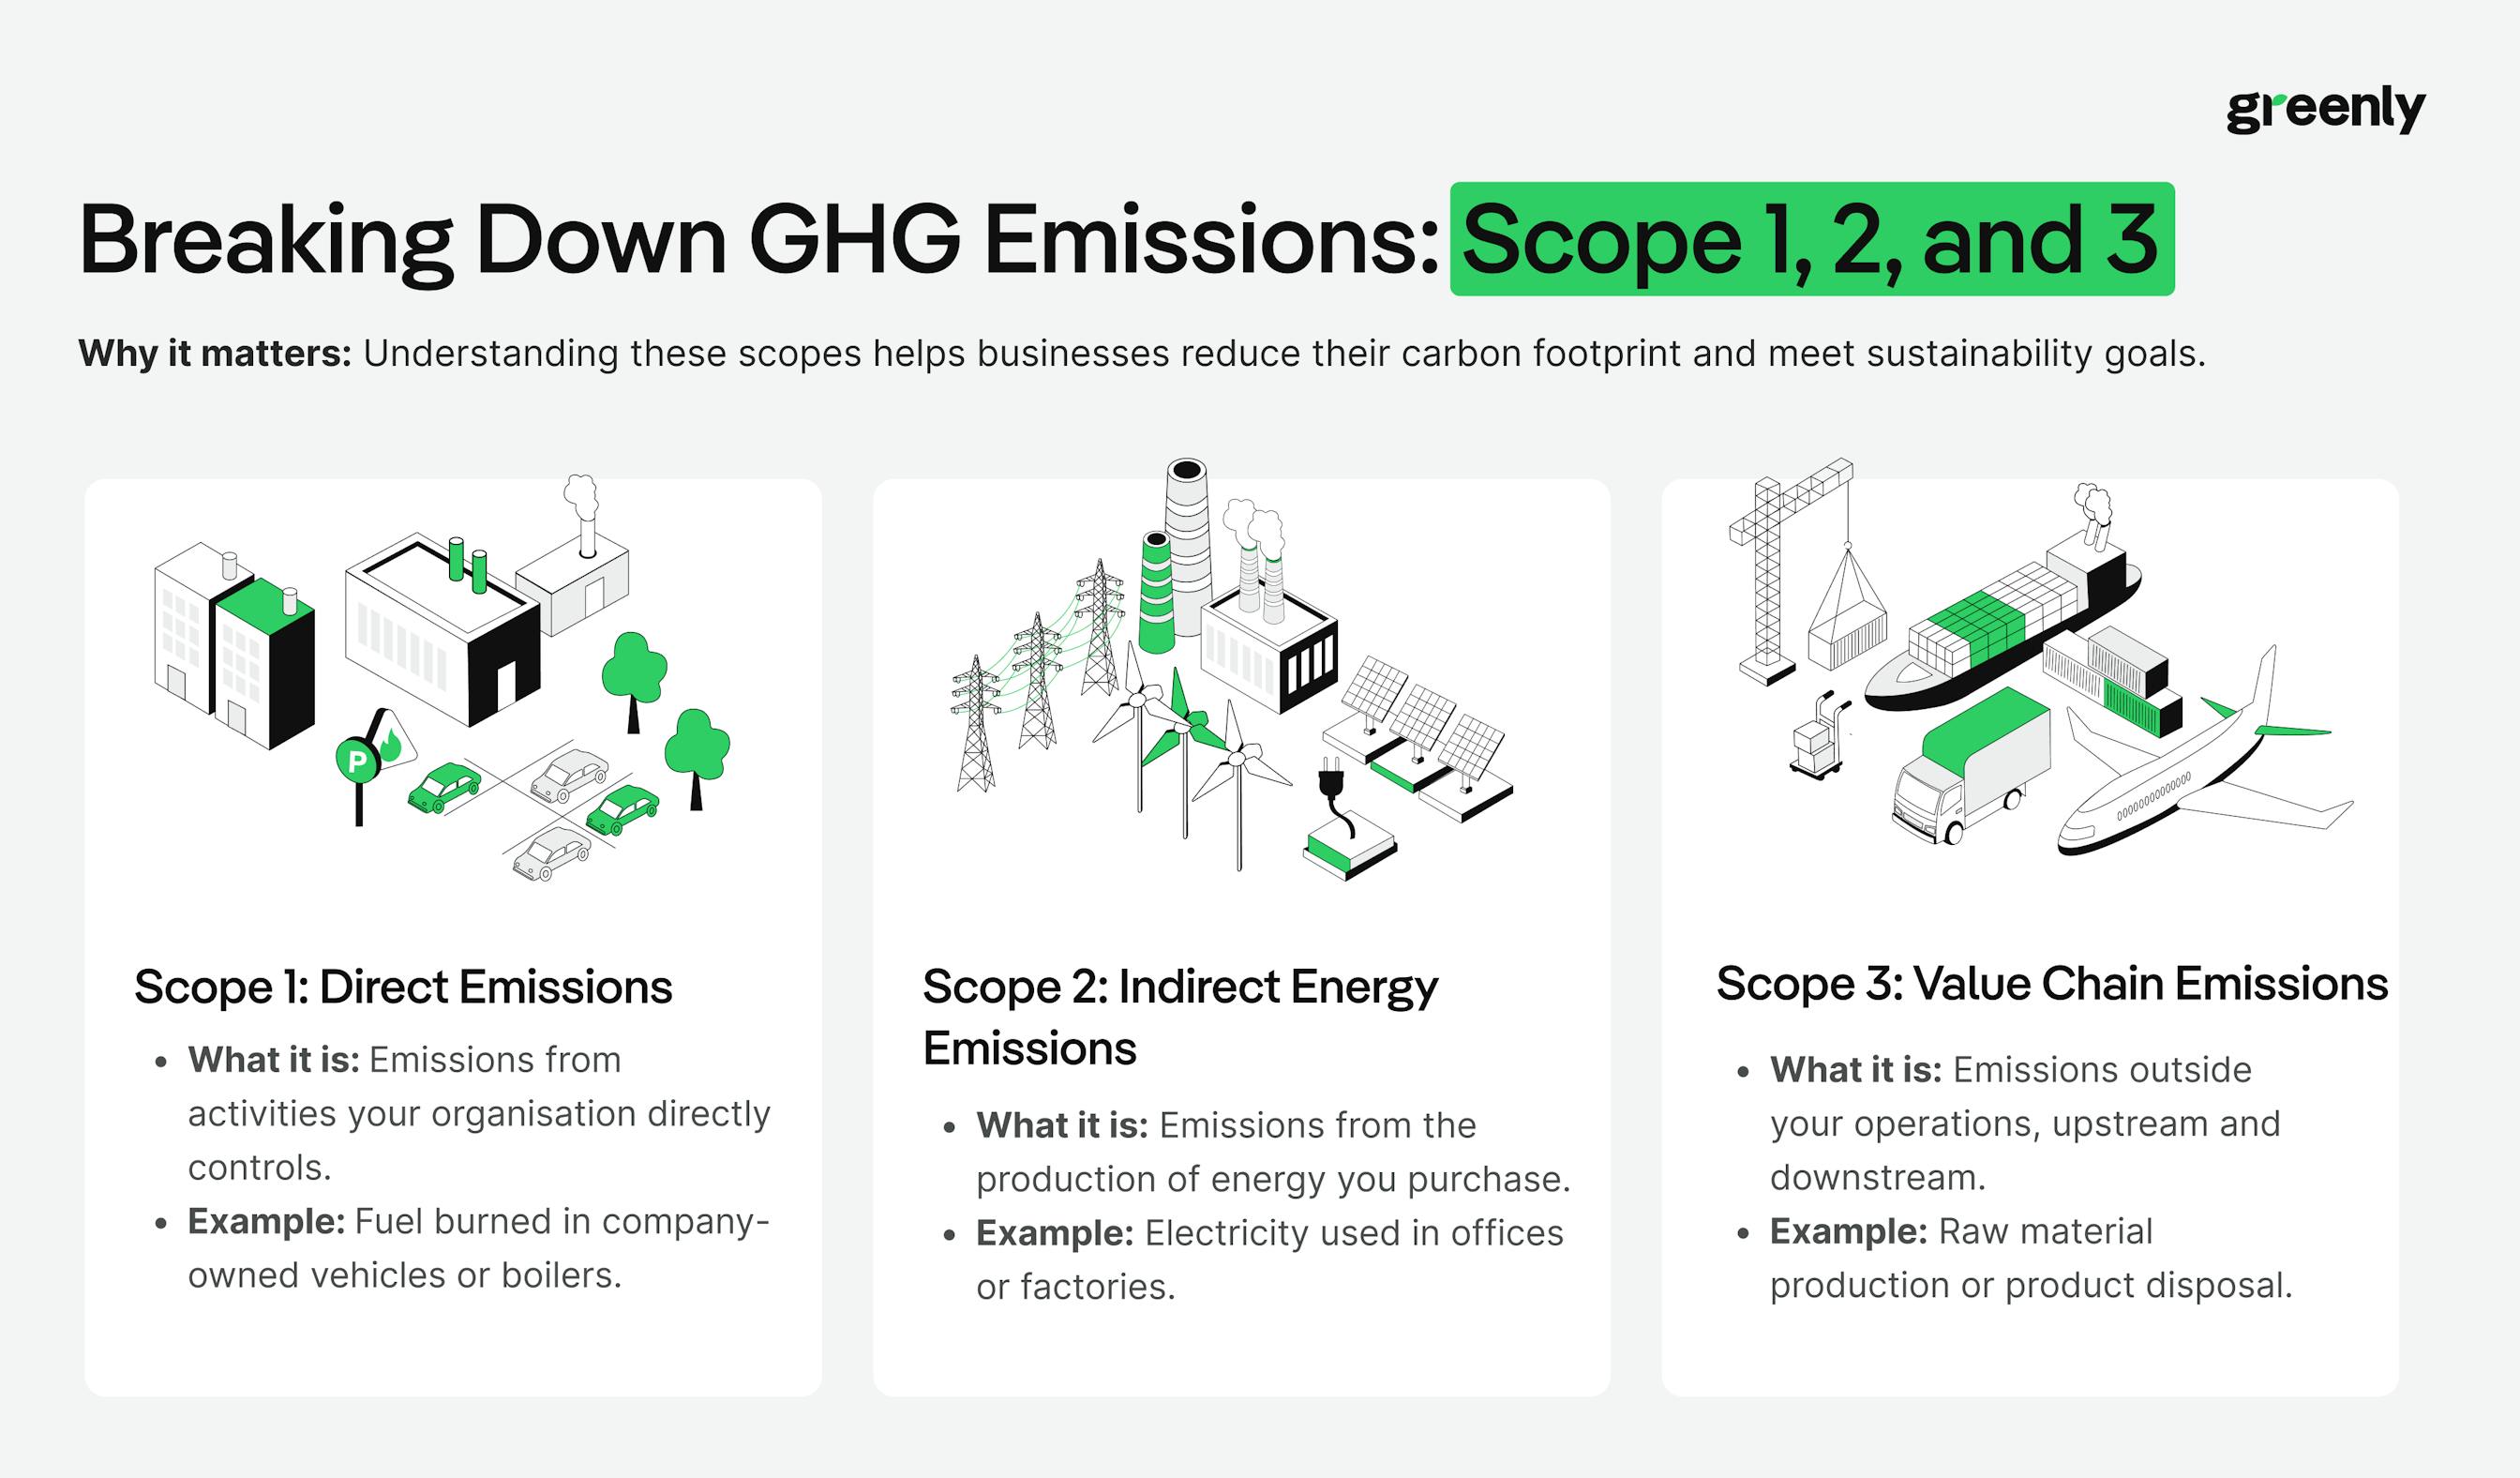
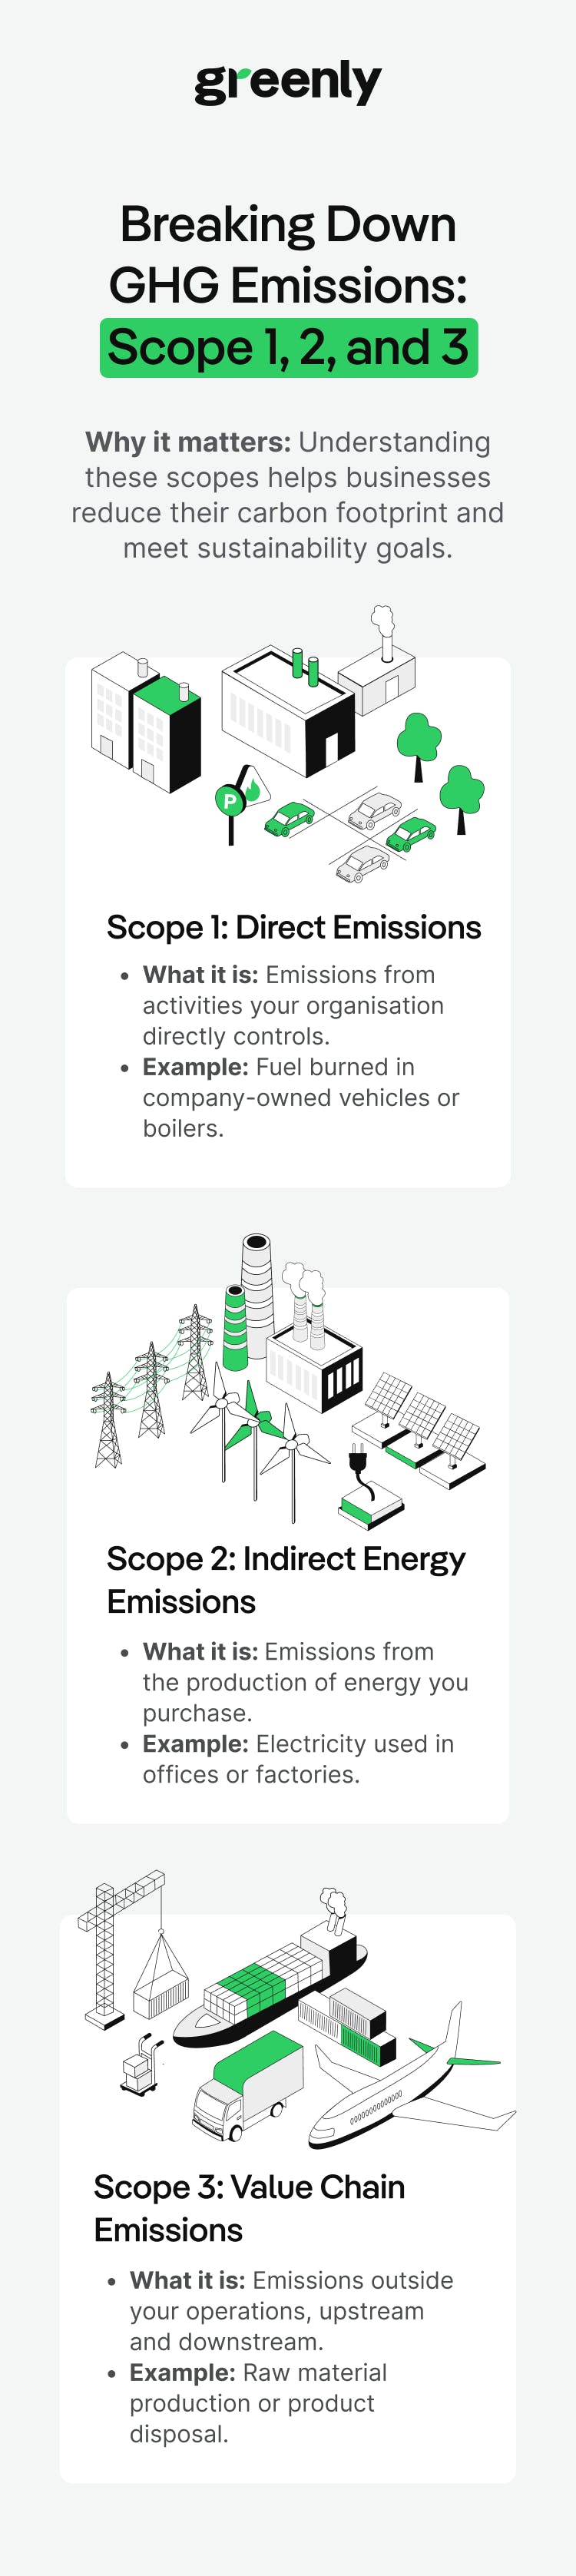
Scope 1, 2, and 3 emissions provide that structure:
Direct emissions from owned or controlled sources.
Indirect emissions from purchased energy.
All other indirect emissions across the value chain.
Together, they form the basis of how companies measure their carbon footprint across operations and value chains, and where they begin when setting targets, reporting data, or identifying reduction opportunities.
What Scope 1, 2, and 3 emissions are, and how they structure corporate carbon reporting
How businesses use this framework to measure emissions and meet regulatory requirements
Why Scope 3 emissions are often the largest share — and the most complex to manage
How companies are improving data quality and turning emissions reporting into actionable reduction strategies
Each of the three scopes represents a different category of greenhouse gas emissions - from those produced directly by a company to those embedded across its supply chain, products, and wider value chain.
Understanding the difference between them is important because it helps businesses identify where emissions come from, which activities they can control directly, and where they need to work with suppliers, customers, or partners to reduce their wider climate impact.
Scope 1 emissions are released directly from sources that a company owns or controls. These are usually the most straightforward emissions to measure because they come from the company’s own sites, vehicles, equipment, or industrial processes.
They typically fall into four main categories:
Fuel burned in fixed equipment such as boilers, furnaces, generators, or on-site heating systems.
Emissions from company-owned or controlled vehicles, including cars, vans, lorries, forklifts, or other fleet vehicles.
Unintentional leaks from systems such as refrigeration, air conditioning, heat pumps, or industrial gas handling.
Greenhouse gases released during production or industrial processes, such as chemical reactions, cement production, manufacturing, or waste treatment.
Companies with factories, vehicle fleets, warehouses, refrigeration systems, or energy-intensive production sites often have significant Scope 1 emissions. Because these emissions come from assets and activities the company controls directly, they are often the first area targeted in a decarbonisation strategy.
Scope 2 emissions are the indirect greenhouse gas emissions linked to the energy a company buys and uses. This includes purchased electricity, steam, heating, and cooling.
These emissions do not usually occur on-site. Instead, they are generated by the energy provider. However, they are still counted in a company’s footprint because they result from the company’s energy consumption.
For most businesses, electricity is the main source of Scope 2 emissions. The level of emissions depends on how that electricity is produced. Power from coal or gas has a much higher carbon intensity than electricity generated from renewable sources such as wind, solar, or hydropower.
Scope 2 emissions are commonly reported in two ways:
Uses the average emissions intensity of the local electricity grid.
Reflects the electricity a company has specifically purchased, such as renewable energy contracts, supplier tariffs, guarantees of origin, or renewable energy certificates.
Reducing Scope 2 emissions usually involves improving energy efficiency, switching to lower-carbon electricity, purchasing renewable energy, or installing on-site generation such as solar panels.
Scope 3 is the broadest category. It covers all other indirect emissions that occur because of a company’s activities, but outside its own operations and purchased energy use.
This includes both:
Emissions that occur before a product or service reaches the company, such as supplier manufacturing, raw materials, transport, and business travel.
Emissions that occur after a company sells a product or service, such as distribution, product use, disposal, recycling, or investments.
Scope 3 is usually the largest and most complex part of a company’s carbon footprint. For businesses with global supply chains, purchased goods, logistics networks, consumer products, or financial investments, it can account for the majority of total emissions.
The Greenhouse Gas Protocol divides Scope 3 into 15 categories:
Emissions from producing the goods and services a company buys, including raw materials, packaging, components, and third-party services.
Emissions from producing long-term assets such as buildings, machinery, equipment, vehicles, or IT infrastructure.
Emissions from extracting, producing, and transporting fuels and energy purchased by the company, excluding what is already counted in Scope 1 or 2.
Emissions from transporting and distributing goods purchased by the company in vehicles or facilities not owned or controlled by the company.
Emissions from the treatment and disposal of waste produced by the company’s activities.
Emissions from employee travel for work, including flights, trains, taxis, rental cars, and hotel stays.
Emissions from employees travelling to and from work, including car use, public transport, and other commuting methods.
Emissions from operating assets leased by the company, where those emissions are not already included in Scope 1 or 2.
Emissions from transporting and distributing sold products after they leave the company, where the transport is not owned or controlled by the company.
Emissions from processing intermediate products sold by the company before they reach final use.
Emissions generated when customers use the company’s products, especially relevant for fuel, vehicles, appliances, electronics, machinery, and other energy-consuming goods.
Emissions from the disposal, recycling, incineration, or landfill treatment of products after use.
Emissions from assets owned by the company but leased to other organisations.
Emissions from franchise operations that are not directly owned or controlled by the company.
Emissions linked to investments, including equity, debt, project finance, and other financial activities.
Scope 3 emissions are often the hardest to measure, largely because the data sits outside the company. It depends on suppliers, logistics partners, customers, and other third parties, which means it’s not always complete or consistent, and often involves a degree of estimation.
At the same time, this is where most of the impact tends to sit. For many businesses, the largest share of emissions comes from purchased materials, product use, transport, and the wider supply chain, rather than from their own operations.
Scope 1, 2, and 3 emissions are defined by the Greenhouse Gas Protocol, developed by the World Resources Institute and the World Business Council for Sustainable Development, to bring consistency to how companies measure and report emissions.
The framework was introduced to solve a practical problem. Companies were already trying to measure emissions, but approaches varied widely, making results difficult to compare or use for decision-making. A shared structure made it possible to track emissions in a consistent, transparent way across organisations and regions.
At its core, the framework separates emissions based on how they relate to a company:
This distinction reflects the difference between what a company directly controls and what it influences through its activities.
It also explains why emissions overlap across businesses. One company’s direct emissions can sit within another company’s Scope 3. For example, a supplier’s manufacturing emissions become part of a customer’s purchased goods footprint.
This overlap is expected. It reflects how emissions move through supply chains, and why addressing them often requires coordination beyond a single organisation.

Unlike Scope 1 and 2, which are largely managed internally, Scope 3 requires companies to look beyond their own activities and work across their value chain. This often means engaging suppliers, reassessing procurement decisions, and understanding how products are used after sale.
As a result, Scope 3 is less about measurement alone and more about coordination. Progress depends on access to better data, stronger supplier relationships, and the ability to prioritise the areas that drive the most impact.
This is also where expectations have shifted. High-level estimates are no longer enough. Frameworks such as the Science Based Targets initiative (SBTi) and evolving regulations increasingly expect companies to improve data quality over time, moving towards supplier-specific and activity-based data.
In practice, this makes Scope 3 a longer-term effort. It requires building systems, engaging partners, and refining data year over year - but it is also where the most meaningful reductions are typically found.

As of May 2026, the era of voluntary ESG has ended for large corporations. Global regulators have shifted from debating frameworks to enforcing deadlines. While the requirements vary by region, they share a common goal: treating carbon data with the same rigor as financial data.
Companies with over $1B in revenue doing business in California must report Scope 1 and 2 emissions.
Scope 3 reporting becomes mandatory from 2027, requiring companies to begin tracking supply chain data now.
The 2024 climate disclosure rule remains in flux following litigation and paused enforcement. While not currently mandatory, many companies continue reporting to meet California requirements and investor expectations.
Large companies are already reporting under CSRD, with first disclosures published in 2025.
Reporting for listed SMEs and some non-EU companies has been delayed to 2027/2028 to reduce administrative burden.
Scope 1, 2, and 3 reporting remains mandatory for companies still within scope.
The UK Sustainability Reporting Standards were finalised in 2026, based on the ISSB framework.
Scope 3 reporting is becoming mandatory for the largest entities, with transitional relief allowing a phased approach.
What this means for your 2026 strategy:
| Requirement | Scope 1 & 2 | Scope 3 |
|---|---|---|
| Status | Baseline necessity. Mandatory for nearly all large entities in the EU, UK, and California. | The 2027 frontier. Moving from “optional” to “mandatory” across major frameworks. |
| Data quality | Must be based on actual meter readings and fuel logs. | Shifting from spend-based estimates to primary supplier data. |
| Auditability | Limited assurance is becoming the standard. | “Good faith” disclosure is currently accepted, but rigor is increasing. |
Pro-Tip: Don't wait for the SEC. If you do business in California or Europe, you are likely already in scope. The focus this year should be on moving from estimated data to verified activity data.
Understanding the scopes is one step. Turning that into usable data is another.
In practice, emissions measurement follows a structured process. It starts with identifying where emissions occur, then building a consistent dataset that can be reported, compared, and improved over time.
Start by identifying the activities that generate emissions across your business and value chain.
This typically includes:
At this stage, the goal is coverage rather than precision, understanding where emissions exist before refining how they are measured.
Once sources are mapped, the next step is gathering the underlying data.
This usually involves:
Data quality can vary significantly, especially for Scope 3. Most companies begin with a mix of primary data (measured internally) and secondary data (estimates or industry averages).
Activity data is then converted into emissions using emission factors - standardised values that translate activity (eg. litres of fuel) into greenhouse gas emissions.
Emissions are typically reported in CO₂e (carbon dioxide equivalent), which allows different greenhouse gases to be compared using a common unit.
These factors are published by recognised bodies such as:
Once activity data and emission factors are in place, emissions can be calculated across each source and aggregated by scope.
At this stage, companies build an emissions inventory - a structured dataset that forms the basis of reporting, target-setting, and analysis.
Initial calculations often rely on estimates, particularly for Scope 3. Over time, the focus shifts toward improving accuracy.
This typically involves:
Emissions measurement is not a one-off exercise. It is an iterative process that improves as data systems, supplier engagement, and internal processes mature.
Even with a clear framework in place, emissions reporting can be difficult to implement. Most challenges come down to data, coordination, and evolving requirements. Here we outline some of the most common obstacles you might face and how to solve them.
Most companies start with imperfect data and processes. What matters is building a system that improves over time, becoming more complete, consistent, and aligned with regulatory expectations.
As reporting requirements become more detailed, many companies move beyond spreadsheets and use carbon accounting software to collect data, calculate emissions, and prepare disclosures.
The right platform can help businesses:
This is particularly useful for companies dealing with complex Scope 3 data. Supplier information, procurement records, transport data, and product lifecycle data can be difficult to manage manually, especially when reporting requirements call for more transparency and auditability.
When choosing a carbon accounting platform, businesses should look beyond calculation features. The most useful tools also support data quality improvement, supplier engagement, reduction planning, and compliance workflows.
Key criteria to consider include:

Scope 1 covers direct emissions from owned or controlled sources. Scope 2 includes emissions from purchased energy. Scope 3 captures all other indirect emissions across the value chain, such as suppliers, transport, product use, and disposal.
It depends on the region and framework. In the EU, Scope 3 is required under CSRD for in-scope companies. In California, it becomes mandatory from 2027. In the UK and US, it is often required when considered material, but expectations are increasing across all markets.
Emission factors are standard values used to convert activity data (such as fuel use or electricity consumption) into greenhouse gas emissions. They are typically published by organisations like the Intergovernmental Panel on Climate Change, national agencies, or the Greenhouse Gas Protocol.
Location-based emissions reflect the average carbon intensity of the local electricity grid. Market-based emissions reflect the specific energy a company has purchased, such as renewable contracts or certificates.
Spend-based data estimates emissions based on how much money is spent (eg. €1,000 on steel). Activity-based data uses physical quantities (eg. kilograms of steel purchased). In 2026, there is a strong shift toward activity-based and supplier-specific data for greater accuracy.
Double-counting occurs when the same emissions are reported by multiple companies in a value chain. For example, a supplier’s Scope 1 emissions may appear as a customer’s Scope 3. This is expected in carbon accounting and reflects how emissions flow through supply chains.
Financed emissions refer to greenhouse gas emissions linked to a company’s investments, loans, or financial activities. They are typically reported under Scope 3 Category 15 and are especially relevant for financial institutions.
Scope 4 refers to emissions avoided through the use of a company’s products or services (eg. renewable energy solutions replacing fossil fuels). It is not an official category under the Greenhouse Gas Protocol, but is increasingly discussed in sustainability strategies.
It depends on the size and complexity of the company. Initial calculations can take a few weeks to a few months. Ongoing reporting becomes faster as data systems, processes, and supplier engagement improve.
Smaller companies are not always legally required to report, but many choose to do so to meet customer requirements, prepare for future regulation, or align with sustainability goals.
Carbon accounting platforms like Greenly's automate data collection, apply emission factors, and generate reports aligned with frameworks. They are particularly useful for managing Scope 3 data and improving accuracy over time.
Share this article
What is decarbonisation and why is it urgent? Learn practical steps companies can take to support the global move toward net zero emissions.

In this article, we’ll break down what IROs are, how to identify and assess them, and what CSRD requires in terms of disclosure.

In this article, we break down what the EU CBAM is, how it works, and what businesses need to do to comply.
